
Rice stands as a fundamental food source for over half of the global population, with Asia, Sub-Saharan Africa, and South America leading in consumption. The vast majority of rice cultivated worldwide belongs to the species Oryza sativa, originating from the Graminaceae family of grasses, with its roots believed to be in Asia. Despite its widespread consumption, rice cultivation is geographically constrained by specific environmental needs. Optimal rice production thrives in regions characterized by high daytime temperatures and cooler nights during the growing season, abundant water resources, level land for effective irrigation and drainage, and a dense subsoil to prevent water seepage. Globally, rice is categorized into four primary types for production and trade, as detailed in Table 1.
Table 1: Types of rice produced worldwide
| Type | Where grown | Percent of global rice trade |
|—|—|—|
| Indica | Tropical and subtropical regions such as India, Pakistan, Thailand, Vietnam, Burma, Cambodia, the Philippines, Indonesia, Malaysia, southern China, and Brazil | 62–66 |
| Aromatic (jasmine and basmati) | Primarily Thailand, Vietnam, Cambodia, India, and Pakistan | 23–25 |
| Japonica | Regions with cooler climates such as Japan, North Korea, South Korea, certain regions of China, California, the European Union, Russia, Australia, and Egypt | 9–10 |
| Glutinous and other specialty rice types | Primarily Thailand, Vietnam, Cambodia, and Laos | 2-3 |
| Source: USDA, Economic Research Service calculations. |
The Journey of Rice: From U.S. Fields to Your Plate
In the United States, rice production is concentrated in four key regions: the Arkansas Grand Prairie, the Mississippi Delta (encompassing parts of Arkansas, Mississippi, Missouri, and Louisiana), the Gulf Coast (Texas and Southwest Louisiana), and California’s Sacramento Valley.
Each of these regions specializes in growing particular types of rice, distinguished by grain length: long, medium, and short. U.S. long-grain rice varieties are known for their dry and separate texture when cooked, while medium- and short-grain varieties tend to be moist, clingy, or sticky. Long-grain rice dominates U.S. production, accounting for approximately 75 percent, followed by medium-grain at about 24 percent, and short-grain at roughly 1 percent. In 2021, the U.S. produced 191.6 million hundredweight (cwt) of rough rice, a 16 percent decrease from 2020, yet still slightly above 2019 levels. The 2022 rice crop further declined by 16 percent year-over-year to 160.4 million cwt, primarily due to drought conditions in California.
Long-grain rice production in the U.S. is predominantly located in the South, with Arkansas being the largest producer, typically accounting for 56–58 percent of the nation’s long-grain crop. California is the primary source of medium-grain rice, producing 70–77 percent, although Arkansas also cultivates a significant amount, especially when California faces drought. Louisiana contributes a smaller share of medium-grain rice, while short-grain rice is almost exclusively grown in California. All U.S. rice cultivation relies on irrigated fields, achieving some of the highest yields globally. U.S. rice farmers employ various seeding methods, including aerial seeding in flooded fields, as well as drilling or broadcasting seed into dry fields. California producers mainly use aerial seeding directly into flooded fields. In contrast, most growers in the Delta region drill or broadcast seed into dry seedbeds, while producers in southwest Louisiana and the Texas Gulf Coast use both aerial seeding into flooded fields and drilling or broadcasting into dry seedbeds.
Marketing years differ by state. In Texas and Louisiana, the marketing year starts on July 1, August 1 in Arkansas and Mississippi, September 1 in Missouri, and October 1 in California. Some producers in Texas and southwest Louisiana can achieve a partial second or “ratoon” crop by reflooding fields post-harvest, utilizing the stubble from the first crop.
Figure 1. U.S. rice from planting to harvest
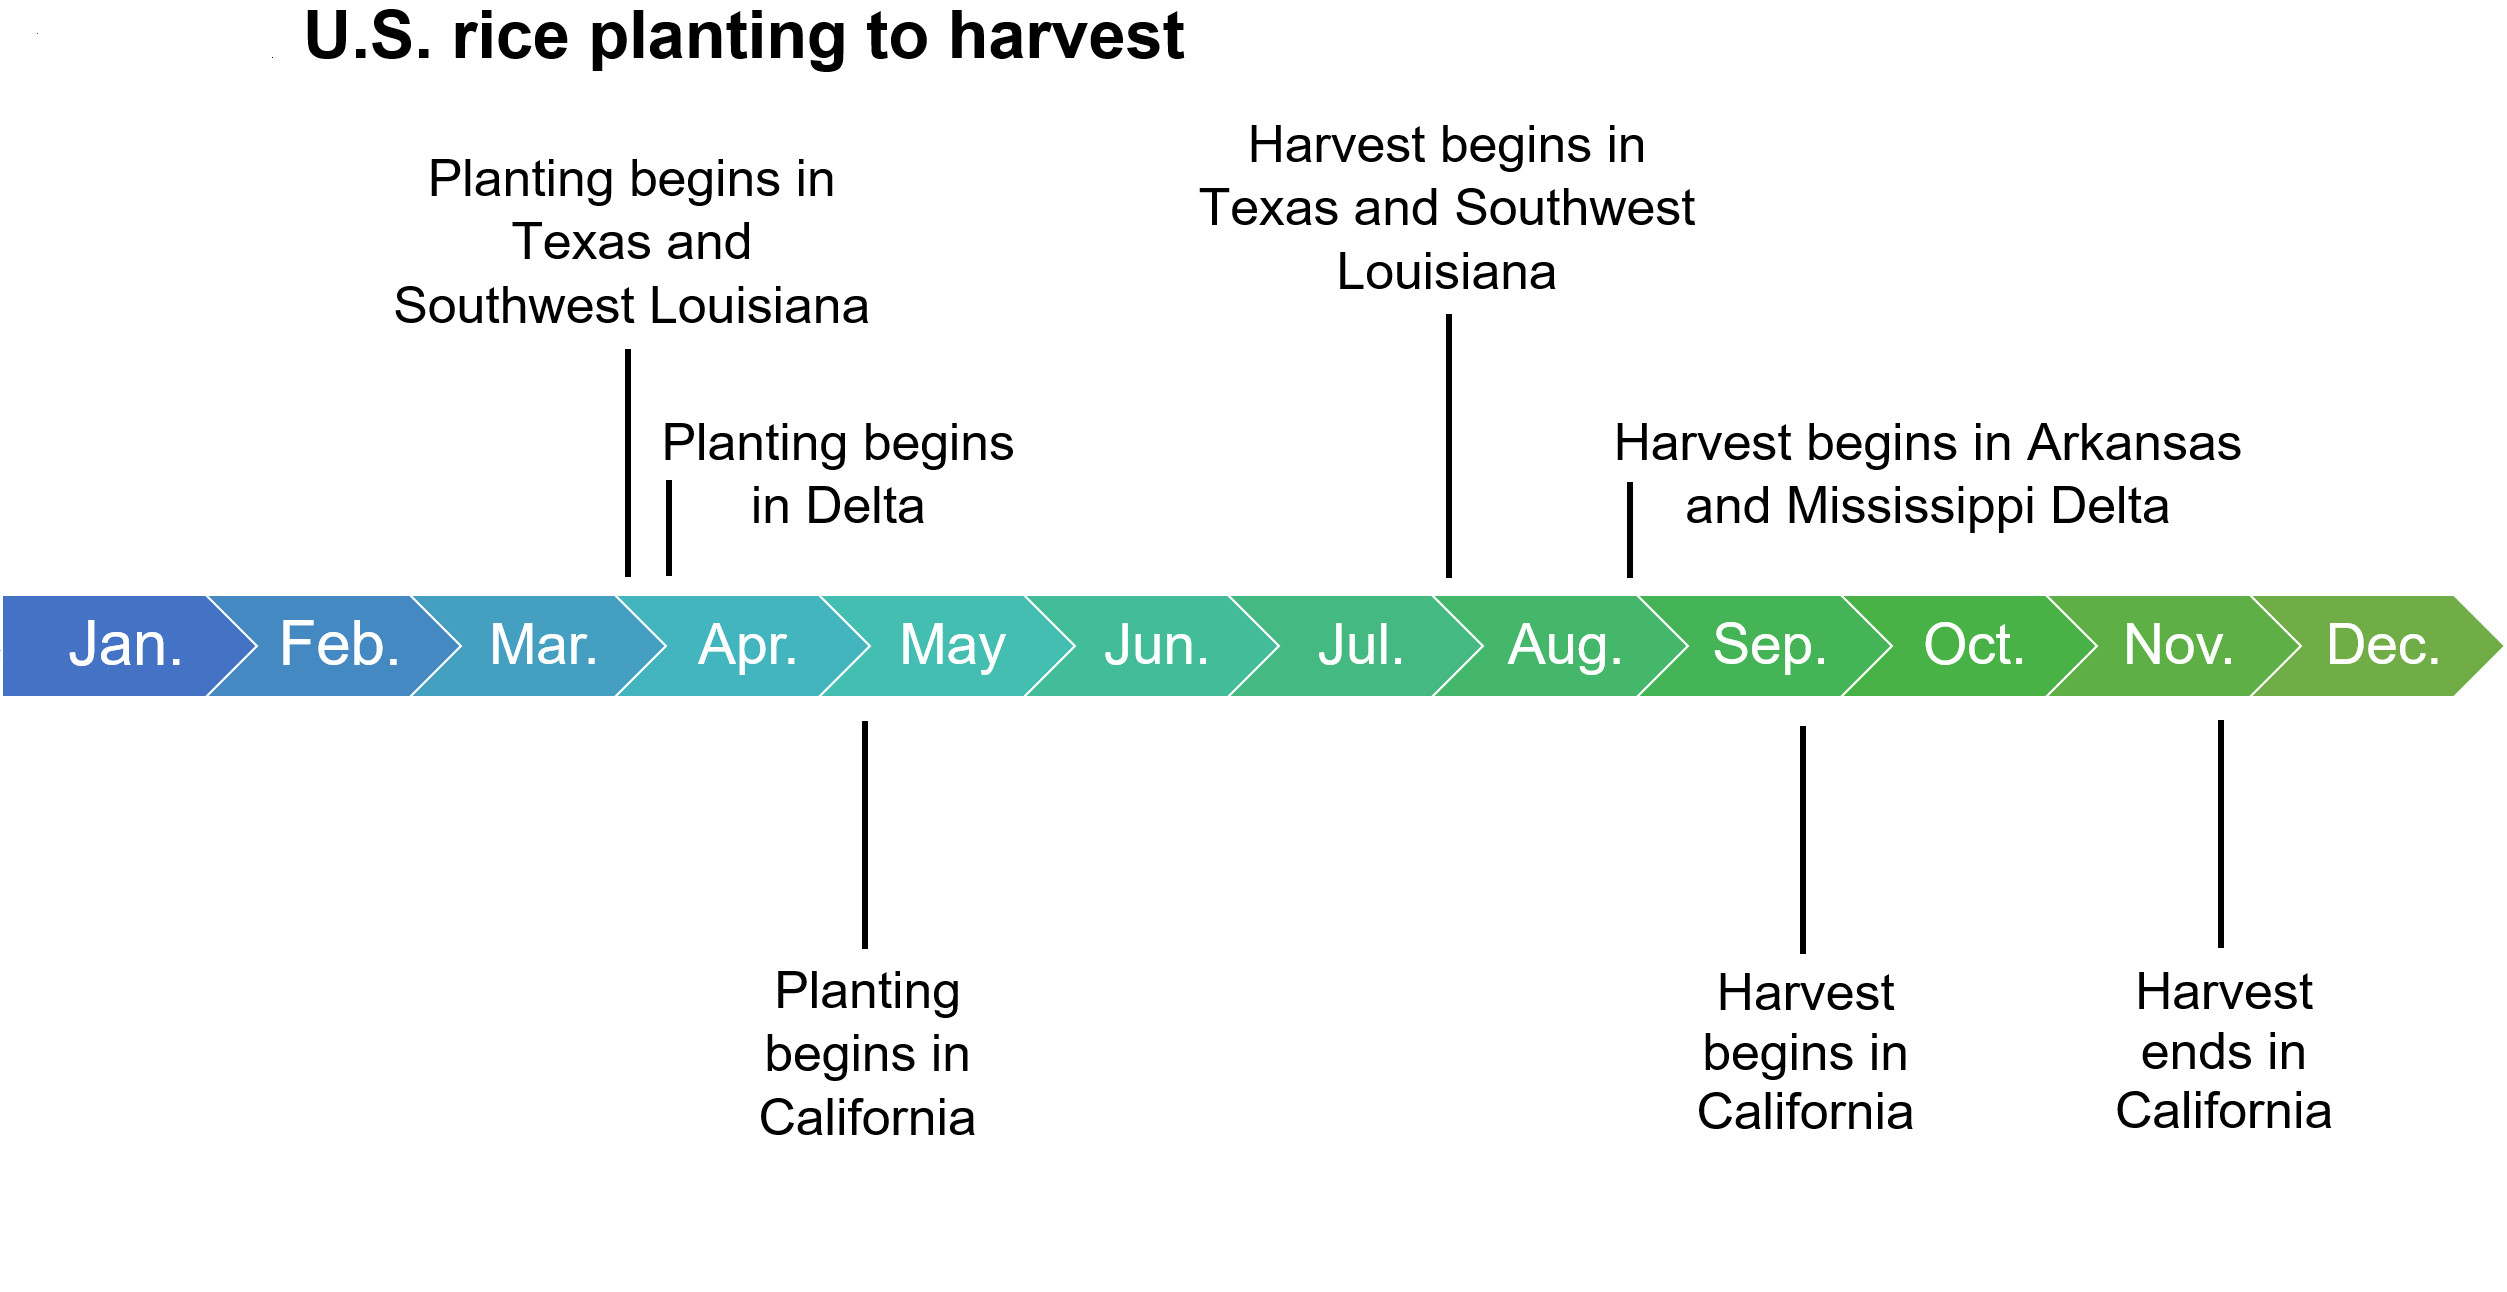 U.S. rice planting to harvest
Alt Text: Diagram illustrating the stages of rice cultivation in the United States, from planting seeds to harvesting mature rice, showcasing key steps in rice farming.
The largest all-rice acreage planted in the United States occurred in 1981, exceeding 3.8 million acres. Throughout the 1980s, participation in acreage-reduction programs and generally low prices led to a decrease in planted acres for most years. However, yields per acre for long-, medium-, and short-grain rice have consistently increased since the 1970s. California typically experiences higher yields per acre compared to the South, largely due to differences in the varieties grown and their yield potential. Severe drought and low reservoir levels caused California rice plantings to significantly drop in 2014 and 2015. While the state’s rice area increased in 2016, it did not fully recover to pre-drought levels. California’s rice plantings were again severely impacted by drought in 2021 and 2022, with 2022 plantings reaching the lowest since 1958. Fortunately, substantial rainfall in late 2022 and early 2023, along with spring snowmelt, helped California’s rice plantings return to pre-2021 levels in 2023.
U.S. Rice in the Global Market: Exports
The United States is a reliable and consistent supplier of high-quality rice in both the long-grain and combined medium- and short-grain global markets. Despite accounting for less than 2 percent of global rice production, the U.S. contributes almost 5 percent of global exports, ranking as the fifth-largest exporter worldwide. Exports are vital to the U.S. rice industry, with 40–45 percent of the crop being exported annually.
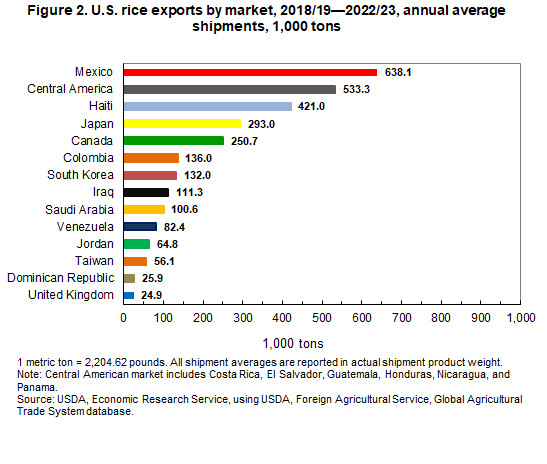 Bar chart of U.S. exports by market in thousand tons of annual average shipments from 2018/19 to 2022/23
Alt Text: Bar chart showing the average annual U.S. rice exports by market from 2018 to 2023, measured in thousand tons, highlighting key international destinations for US rice.
U.S. rice exports encompass various forms:
- Rough (unmilled) rice
- Parboiled rice
- Brown rice
- Fully milled (white) rice
Currently, milled rice (including brown and parboiled rice) constitutes 52–56 percent of U.S. rice exports, closely followed by rough rice. The export of rough rice began to increase significantly in the mid-1990s as several Latin American countries, notably Mexico and Central American nations, reduced producer support and opened their markets to rice imports. Initially, the United States faced minimal competition in these primarily rough rice markets, often supplying 95–100 percent of their rice imports. However, since 2010, South American exporters have increased their shipments of milled rice, and more recently rough rice, to these markets, now accounting for 30–80 percent of rice imports in some of these countries.
Since 2008, the United States has also been exporting rice to Colombia (both rough and milled) and Venezuela (rough rice), facing increasing competition from South American exporters, especially Brazil, Paraguay, and Uruguay. Asian exporters, with the exception of shipments from Vietnam to Cuba, generally have limited rice exports to Latin America. Historically, the U.S. was the primary major exporter of rough rice, although most South American exporters, being medium-sized, also shipped some rough rice to Central and South American countries. Since 2020, Brazil has significantly increased its rough rice exports to Mexico and Central America. Paraguay has also recently started exporting rough rice to Mexico and expanded its sales to Central America. Outside of Latin America, Cambodia is a regular exporter of rough rice to neighboring Vietnam.
Demand for U.S. parboiled rice began to decline in the mid-1990s, with the European Union (EU) and the Middle East being the primary markets and experiencing the most significant reductions in demand. The United States also exports processed rice products like rice cakes, rice mixes, and cereal, although these remain a small fraction of total U.S. rice exports. Small quantities of broken kernel rice are also exported annually, typically making up almost 2 percent of the total export volume.
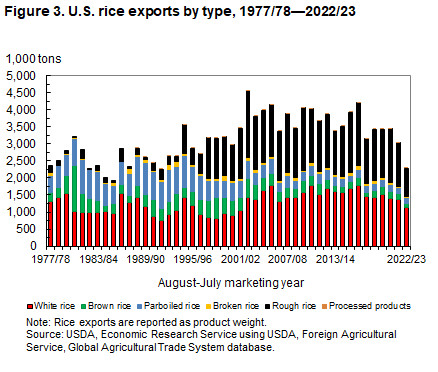 Bar chart of U.S. exports by type in thousand tons for the years 1977/78 to 2022/23 August-July marketing year.
Alt Text: Bar chart showing trends in U.S. rice exports by type from 1977 to 2023, measured in thousand tons, illustrating the changing composition of US rice exports over decades.
U.S. Rice in the Global Market: Imports
U.S. rice imports have tripled since 2001/02. The majority of these imports are specific aromatic varieties from Asia, such as jasmine rice from Thailand and basmati rice from India and Pakistan. Since 2011, South American exporters have annually shipped 15,000–40,000 tons of non-aromatic, long-grain milled rice to the United States, primarily due to competitive pricing. Additionally, China resumed exporting medium-grain rice to Puerto Rico, a U.S. territory, in 2018. In 2022/23, Australia also shipped approximately 38,600 tons of medium- and short-grain milled rice to the U.S. due to drought-related production shortfalls in California. Since 2019/20, the United States has imported, on average, more than 14 percent of its total rice supply, up from 10 percent during 2014/15–2018/19.
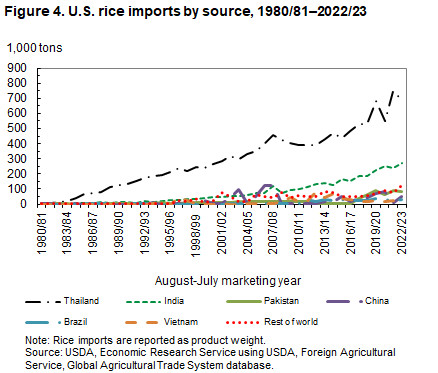 Line chart of U.S. rice imports by source in thousand tons for the years 1980/81 – 2022/23
Alt Text: Line chart depicting the evolution of U.S. rice imports by source country from 1980 to 2023, measured in thousand tons, showcasing shifts in import origins over the years.
From Rice Paddy to Product: Marketing and Use
Rough rice can be processed into five distinct products: hulls, bran, brown rice, whole kernel milled rice, and brokens. Brokens are further categorized by size into second heads, screenings, and brewers.
The initial milling stage removes the hull, resulting in brown rice, which is edible and can be consumed directly. The subsequent stage removes the bran layer, producing whole-kernel milled white rice and some broken kernels as a byproduct. Rice bran is largely used in animal feed.
Before milling, rough rice may undergo parboiling, a process involving soaking and steaming under pressure. Parboiling reduces breakage during milling and enriches the kernel by driving nutrients from the bran layer into it. Parboiled rice typically commands a higher market price than regular milled rice.
The United States has established five or six grades and grading standards for rough rice, brown rice, milled rice, and the three categories of broken kernel rice (second-heads, screenings, and brewers). Grading criteria generally include limits on seeds and heat-damaged kernels, paddy kernels, red rice and damaged kernels, and chalky kernels, as well as requirements for color, well-milled kernels, and minimum milling standards. Red rice is characterized by whole or large broken kernels with significant red bran content.
Careful handling throughout production, drying, storage, milling, and marketing is essential to minimize broken kernels, which are sold at a considerable discount compared to whole-kernel rice. Virtually all rice purchased by U.S. consumers or restaurants is whole-kernel milled rice. However, 15–17 percent of the U.S. rice crop is exported annually as rough (unmilled) rice, which is then milled in the importing country.
Long-term growth in rice consumption in the U.S. is partly attributable to changes in the country’s ethnic composition, with groups that traditionally consume more rice increasing as a proportion of the U.S. population. Growing demand for gluten-free foods and the introduction of new rice-based products also contribute to increased domestic use. Within the U.S., rice is used for direct human consumption, in processed foods, beer production, and pet food.
In many other countries, population growth is a primary driver of increased rice consumption, particularly in regions where rice is a staple food, mainly in Asia and much of Latin America. In Sub-Saharan Africa, both population growth and rising per capita consumption are boosting overall rice consumption. However, global per capita rice consumption is generally decreasing as countries develop and diets shift towards more meat and fewer staple grains.
Government Influence: U.S. Policies Affecting Rice Producers
Under Title I of the Agricultural Act of 2018, the USDA’s Farm Service Agency (FSA) manages two crop commodity programs, Price Loss Coverage (PLC) and Agriculture Risk Coverage (ARC), initially authorized in the Agricultural Act of 2014 Farm Act. In addition to PLC and ARC, the FSA also operates the Marketing Assistance Loan Program, which evolved from the commodity loan program established under the Agricultural Adjustment Act of 1938, with significant modifications starting in 1985. Rice growers primarily utilize the PLC program.
Producers with base acres of rice and other covered commodities can enroll in the PLC program for each commodity. Payments are triggered when the market-year average price falls below the effective reference price. The 2018 Farm Act set the statutory reference prices for rice as follows:
Table 2. Statutory reference prices, 2018 Farm Act
| Long-grain rice | $14.00 per hundredweight |
|---|---|
| Southern Medium and short Grain | $14.00 per hundredweight |
| Temperate Japonica (California) 1/ | $17.30 per hundredweight |
1/ The effective reference price for the 2022 crop is $17.79 per hundredweight.
The 2018 Farm Act sets the loan rate for all rice crops at $7.00 per hundredweight.
Global Rice Production and Consumption Patterns
Globally, China is the leading rice-producing nation, followed by India.
Table 3. Top 10 rice-producing countries, 2018/19–22/23
| Country | Annual average production, milled basis (million tons) | |
|—|—|—|
| China | 147.691 | |
| India | 125.038 | |
| Bangladesh | 35.511 | |
| Indonesia | 34.360 | |
| Vietnam | 27.099 | |
| Thailand | 19.529 | |
| Burma | 12.530 | |
| Philippines | 12.249 | |
| Japan | 7.591 | |
| Pakistan | 7.530 | |
| 1 ton = 2,204.62 pounds. Source: USDA, Foreign Agricultural Service, Production, Supply and Distribution database. |
Table 4. Top 10 rice-consuming countries, 2020/21–22/23
| Country | Annual average consumption, milled basis (million tons) 1/ | |
|—|—|—|
| China | 153.683 | |
| India | 109.166 | |
| Bangladesh | 36.733 | |
| Indonesia | 35.367 | |
| Vietnam | 21.450 | |
| Philippines | 15.400 | |
| Thailand | 12.700 | |
| Burma | 10.367 | |
| Japan | 8.183 | |
| Nigeria | 7.333 | |
| 1 ton = 2,204.62 pounds. 1/ Includes a residual component that accounts for post-harvests losses in processing, marketing, and transporting. Source: USDA, Economic Research Service using USDA, Foreign Agricultural Service, Production, Supply and Distribution database. |
The Global Rice Trade Network
Rice Exports Worldwide
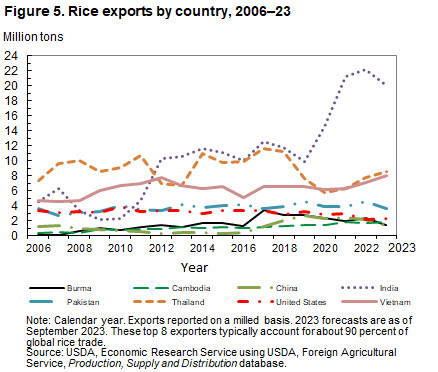
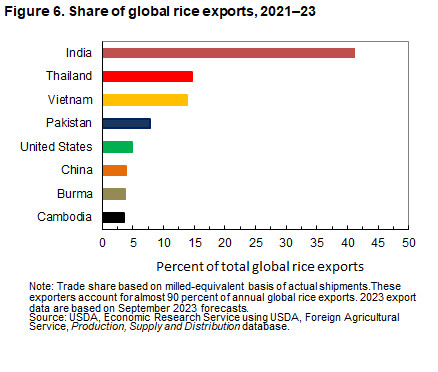
Since 2012, India has emerged as the world’s largest rice exporter, currently shipping more rice annually than the combined exports of the next three largest exporters. India’s rice exports saw a nearly 49 percent increase in 2020, followed by a further 46 percent rise in 2021, exceeding 21 million tons, and peaking in 2022 at 22.1 million tons. However, projections indicate a decline in India’s exports for 2023 and 2024 due to government-imposed export restrictions. The next largest rice exporters include Thailand, Vietnam, Pakistan, the United States, China, Burma, and Cambodia. Together with India, these countries account for 90 percent of the global rice trade. Cambodia began increasing its exports in 2009, reaching near-record levels currently. China significantly boosted its exports in 2017, re-emerging as a major exporter in 2018, although recent shipments have decreased. In contrast, U.S. rice exports decreased by 26 percent in 2022 due to a smaller crop and less competitive prices. Thailand’s exports experienced substantial drops in 2019 and 2020, and despite some recovery, remain below historical levels. Pakistan’s exports fell by 20 percent in 2023 due to severe flooding in the summer of 2022.
 Line chart of rice exports in million tons by country from the years 2006 to 2023
Alt Text: Trend line chart showing rice export volumes in million tons by major exporting countries from 2006 to 2023, illustrating shifts in global rice export leadership.
 Bar chart of the share of global rice in percent of total global rice exports for the years 2021 to 2023.
Alt Text: Comparative bar chart displaying the percentage share of global rice exports for leading exporting countries between 2021 and 2023, highlighting each country’s contribution to the global rice export market.
Global Rice Imports and Demand
Sub-Saharan Africa remains the largest rice importing region globally, slightly surpassing total imports by all of Asia and representing about 30 percent of global rice imports. The Middle East is another significant import market, covering over 70 percent of the region’s rice consumption through imports. Southeast Asia is also a key import market, showing recent growth after a period of stagnation as regional production increased. The Philippines is the largest rice importer in Southeast Asia and currently the world’s largest rice importer, importing almost 4 million tons annually. East Asia’s rice imports were significantly increased in 2021 and 2022 by large purchases from China, but imports have since returned to more typical levels. South Asia is the smallest rice importing region in Asia, although Bangladesh’s imports can surge after crop shortfalls, such as in 2017 and 2018 following weather-related harvest reductions, and again in 2021 after a poor harvest. Rice imports by South America are projected to increase by about 13 percent in 2023, with Brazil accounting for most of the anticipated growth. From 2012–2022, South American imports were relatively stable due to stagnant or declining consumption growth and consistent regional production. Both North America and the EU are currently importing record or near-record quantities of rice, although per capita rice consumption in these regions is low compared to Asia and Sub-Saharan Africa. These regions are significant markets for Asian aromatic rice varieties and specialty rices, which are high-value and represent an increasing portion of the global rice trade.